We often hear (and agree with the fact) that the U.S. spends an exorbitant amount of money on healthcare. Moreover, U.S. healthcare spending is projected to increase further to 19.4% GDP by 2027. While the U.S. is not alone in seeing growth in healthcare spending, we believe that such spending trends are unsustainable and present a major challenge for both individuals and the country as a whole. While population aging and unhealthy lifestyles certainly play a role, in our view, the biggest drivers of increased healthcare spending are:
- Technology: Advances in medical technology (new treatments, procedures, devices, etc) will continue to drive healthcare spending upward, unless the country takes an active and systematic approach to managing their use, clearly establishing their appropriate role in medical practice and pricing.
- System incentives: Healthcare providers have both financial and legal incentives to provide more care, while insured patients demand healthcare services without regard for total spending, since they only pay a fraction of that amount out of pocket.
Starting with system incentives for providers in this blog, we would like to review the status quo and propose some ideas on how to address these key drivers.
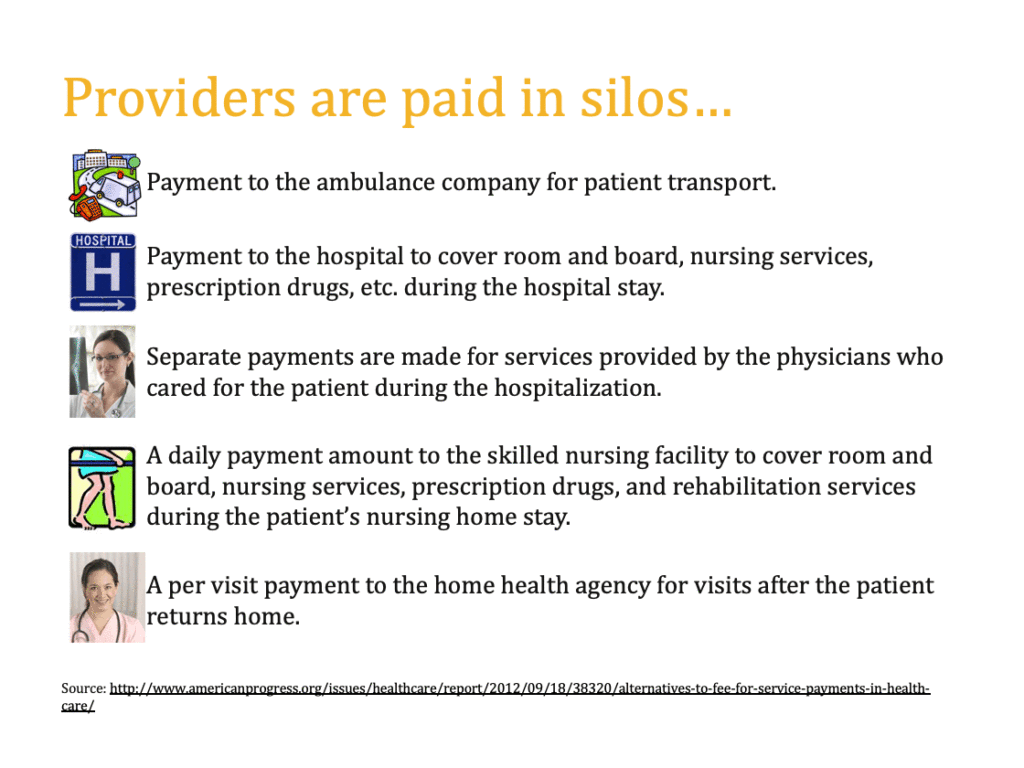
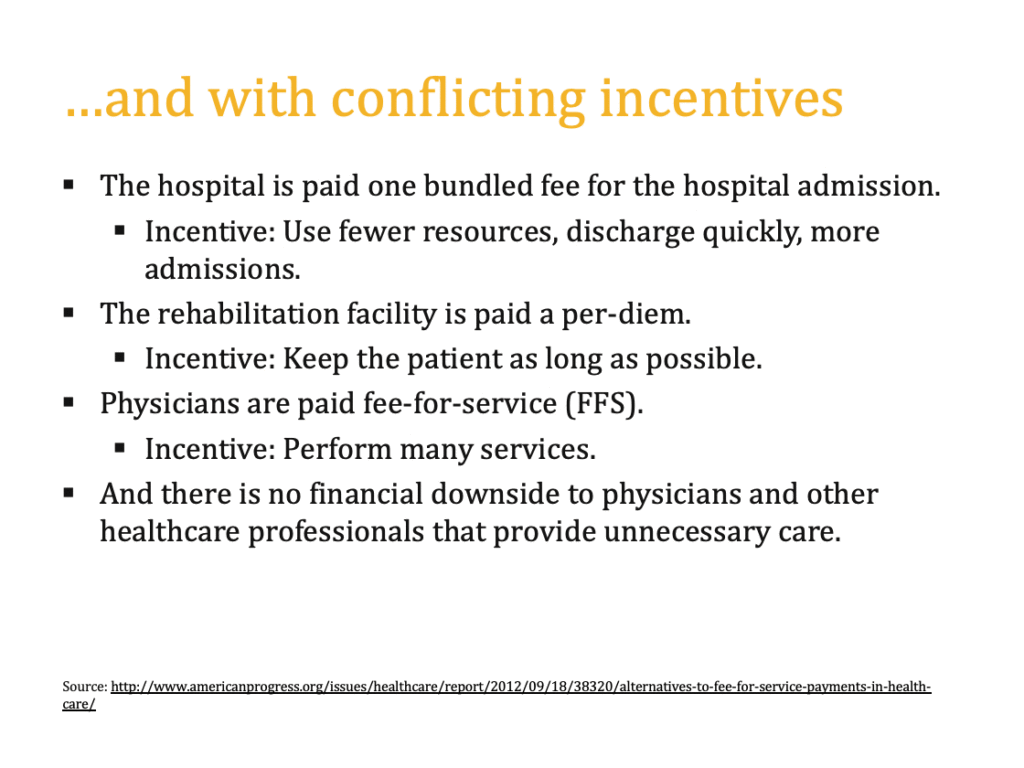
So, let’s take a deeper dive into how we currently pay for healthcare and the types of incentives this creates for healthcare providers. Calsyn and Lee do a great job of demonstrating the complexity and inefficiency that plague our system in Alternatives to Fee-for-Service Payments in Health Care by examining a hypothetical patient with a chronic condition who gets admitted to a hospital. Figures 1 and 2 highlight that not only will the patient come in contact with a multitude of providers during a single episode, but also that all providers will be paid separately and with conflicting incentives to boot.


And if you think payment incentives do not influence care, let’s examine the difference in provider incentives and the corresponding length of stay for a total knee replacement procedure in the U.S. and Japan. As indicated above, U.S. hospitals are paid under the DRG system = lump sum per admission, while Japanese hospitals are paid under DPC = per diem. Perhaps not surprisingly, the length of stay for a total knee replacement in the U.S. is ~3.5 days, while in Japan it is 29 days.
For additional proof of the impact of incentives, let’s take a look at how Medicare has tried to address the growth in healthcare spending over the last 30 years – primarily through controlling the line item prices of services. However, total cost is defined by a simple formula,
Total cost = Price x Use Rate
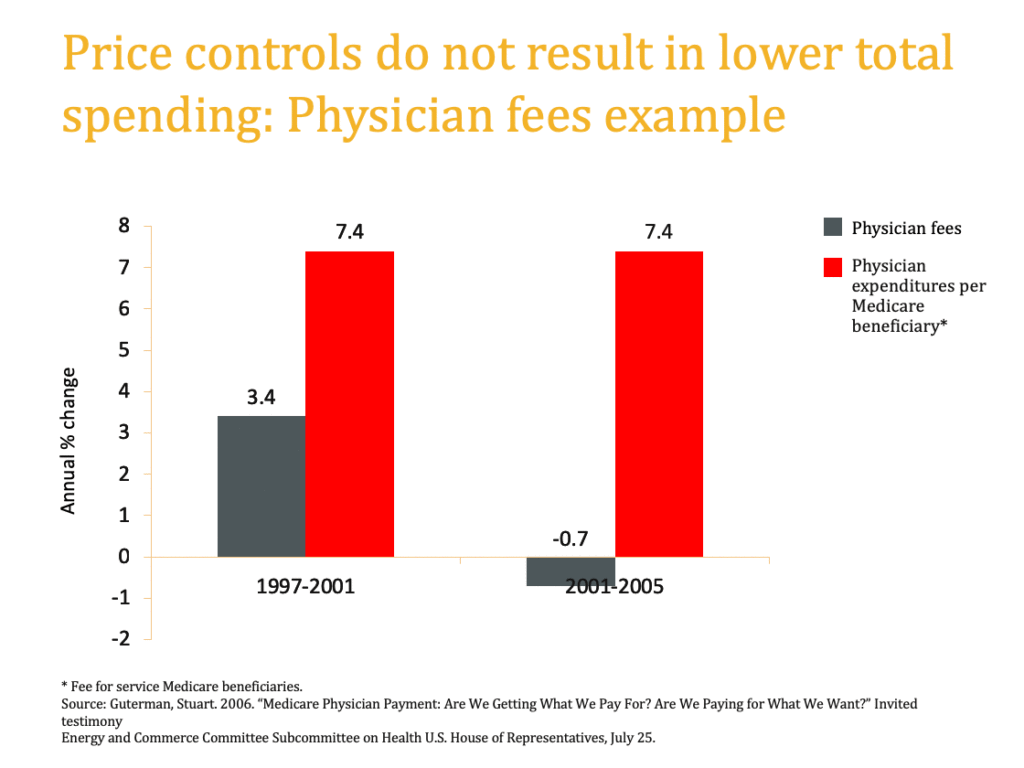
Figure 3 shows the impact of a reduction in prices by Medicare on the total cost for physician services for FFS Medicare beneficiaries. Clearly, Medicare (and the country as a whole) would have been better off heeding Grayson’s maxim:
“Add [price] controls and you will see ‘new’ services appear. Expect ‘unbundling’ of services with the price of individual units, when added together, totaling more than the original services.”
C. Jackson Grayson, Jr.; Chair, U.S. Price Commission (1971-1973)

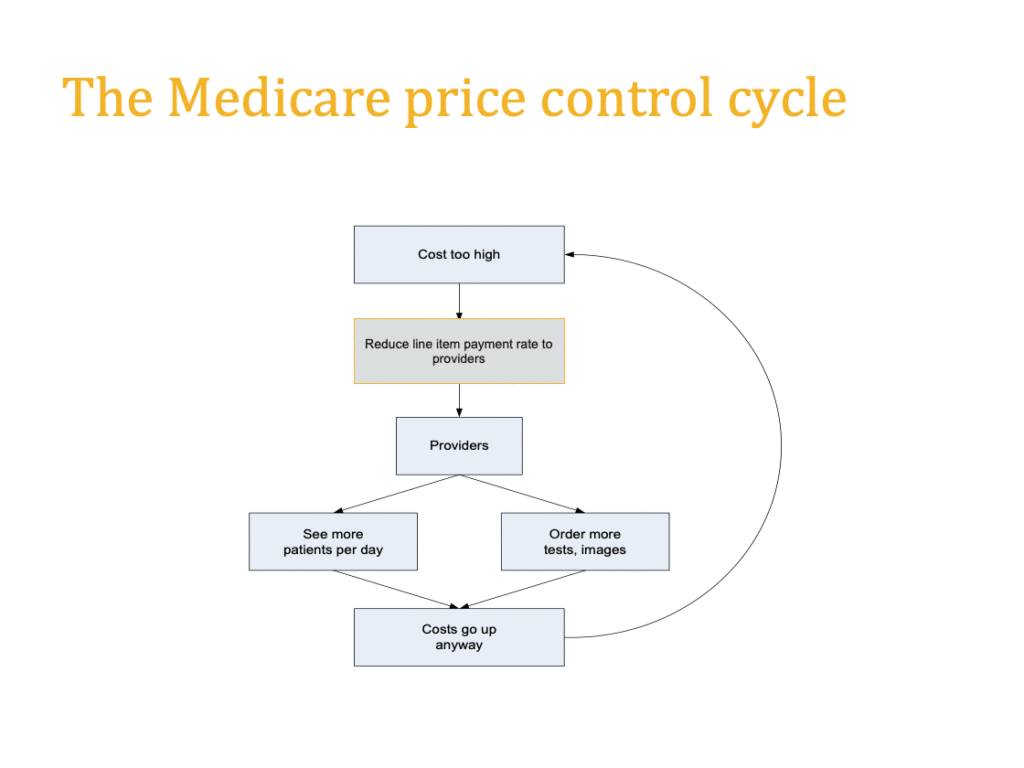
Instead, we ended up with the Medicare price control cycle, as highlighted in Figure 4.

So, if price controls are not the silver bullet to solving the growth in U.S. healthcare spending, how can we begin to address the issue of incentives and move providers toward higher value care? We believe that if we actually pay for value, we are more likely to get it and in the next blog we are going to provide some ideas on what such payment structures could look like. In the meantime, we invite you to think about what we want the value-based payment to accomplish. Some key features we think the payment structure(s) need to have are:
- Encourage care coordination
- Discourage unnecessary care
- Avoid incentive to deny care
- Encourage patient involvement
Excellent and succinct explanations – the four bullet points get to the heart of our quest for disruptive innovation in health care delivery.
Any pilot project or new effort to change our current delivery system should be required to address all four categories.
And, a complete effort will include changes from the consumer, to providers, to society and its alignment with the goals of health reform.